Mobility is major cause of carbon emission, thus a key domain to fight climate change. In fact, it contributes to 29% of total economy-wide greenhouse gas emissions in the US and EU (Japan: 17%). Nevertheless, individuals and cities are, frequently, not aware of their own mobility CO2 footprints. This issue needs to be addressed urgently as data shows that since 1990, transport emissions in the EU have grown by 33%.
ODALA uses a mobility data toolkit, data-centric based, ML supported solutions that compute fine-grained CO2 footprints. The goal is to use crowd-sourced data to improve awareness and behavioral changes in people and organizations. The analysis of these footprints can provide incentives to change individual behavior and inform city-wide demand and supply changes (e.g., new bus routes, infrastructure changes).
The goal of the ODALA Mobility Data Toolkit (MDT) is to utilize multiple available data sources to estimate real-time CO2 mobility footprints in form of a “Green Transport Twin” for a city. Understanding CO2 footprints of cities transportation networks is crucial to enable a green transformation of Europe as it helps city legislators to take actions to reduce CO2 footprint and track progress through time.
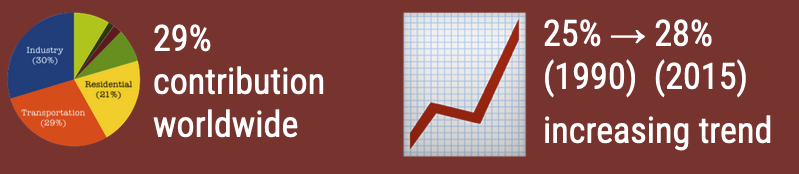
Figure 1. Worldwide emissions and emission trends from transportation sector. Transportation is one of the main drivers of emissions in the world.
The ODALA Mobility Data Toolkit consists of multiple loosely coupled components (see also Figure 2 below).
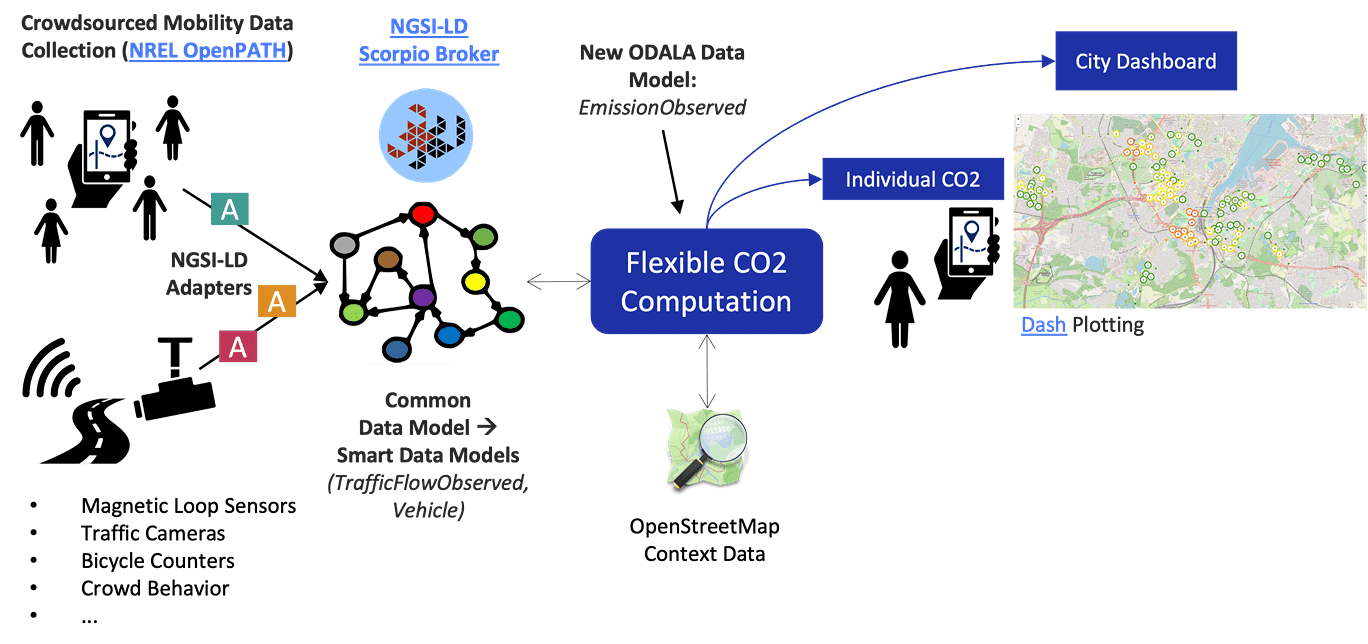
Figure 2. Mobility Data Toolkit Components
The NREL OpenPath framework (https://www.nrel.gov/): To collect individual mobility traces directly from a smartphone application installed on the end user devices of the citizens. The open-source framework is maintained by the National Renewable Research Laboratory (NREL) with contributions by NEC:
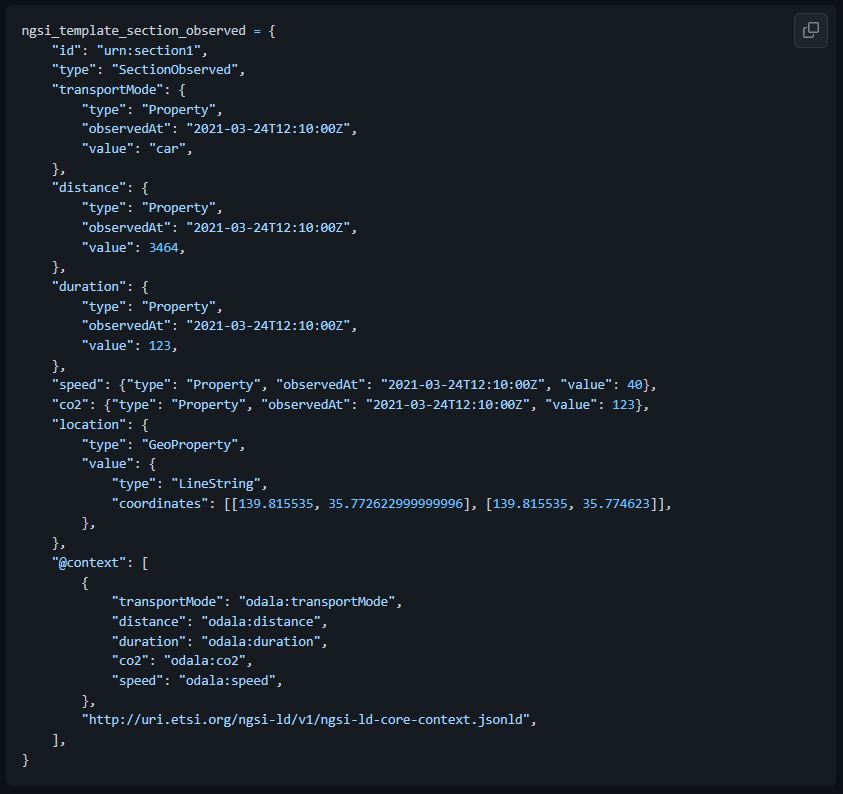
OpenPath NGSI-LD Adapter: An adapter developed by NEC in ODALA to push data from the OpenPath ecosystem to an NGSI-LD context broker. To represent the detailed timeseries data from OpenPath, we designed a new NGSI-LD entity type named named SectionObserved that represents user sections from OpenPath (i.e., a timeseries of coordinates that represents a section of a user trip, e.g., a person taking a bus ride or drive in a car). In SectionObserved we abstract such section to a simple GEOJson linestring, which we obfuscate by changing the real start and end of the section is randomly. This allows the sharing of such data, e.g., as open data, without intruding into individuals privacy.
NGSI-LD Context Broker: An NGSI-LD compliant context broker is needed to let all components exchange data in NGSI-LD. We are using the open source Scorpio broker (https://github.com/ScorpioBroker) that is maintained by NEC.
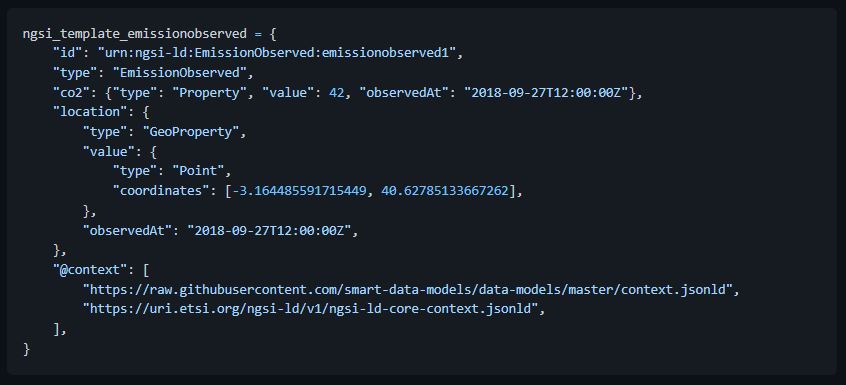
Green Transport Twin: The Green Transport Twin (GTT) has the goal to estimate the current CO2 footprint (Emission). GTT queries data from the NGSI-LD context broker (TrafficFlowObserved, Vehicle and SectionObserved data types). For each observed TrafficFlowObserved/Vehicle, it then uses close-by SectionObserved data if available to estimate the approximate length of this specific TrafficFlowObserved/Vehicle observation. Recall that TrafficFlowObserved/Vehicle data is obtained from fixed sensors in the city (e.g., magnetic loop sensors, cameras, bicycle counters) and therefore cannot tell alone how long the associated section/trip of an observation has been. E.g., if we observe a car passing by, we do not know only from this observation of the car trip has been 5km or 50km. However, this length is crucial for CO2 estimation. Therefore we use the available SectionObserved data from OpenPath to estimate the length of each TrafficFlowObserved/Vehicle observation. After we estimate the length, we then calculate the CO2 footprint/emission using the transport-co2 library. This estimation is based on numbers provided by the European Environment Agency (EEA) which provides CO2 per km numbers for different transport modes on their website. We then push the estimated CO2 data to the NGSI-LD context broker using the newly defined EmissionObserved data model.
Vehicle Simulator (optional): We also developed a simple simulator to generate data of the FIWARE Vehicle Type. This simulator allows the user to configure sensing points in arbitrary places in the city and then uses a simple traffic model together with data queried from OpenStreetMap to simulate sensed vehicles (e.g., cars, trucks, bicycles…). Note that in an actual deployment, this simulator is not needed, but deployment cities of the mobility data toolkit need simply to push data of type TrafficFlowObserved or Vehicle to their NGSI-LD context broker. Dependent on the city, this data can come from various sensors such as magnetic loop sensors, traffic cameras, bicycle counters or even manual traffic counting.
NGSI-LD adapters: These adapters map and transform data to NGSI-LD in the Vehicle and TrafficFlowObserved data models:
from MDM, the German National Access Point for Mobility Data (mdm_adapter).
from a NGSIv2 endpoint (ngsiv2_adapter)
Dash Dashboard: To visualize the mobility data and the CO2 emissions, we employ Dash. We developed an NGSI-LD plugin that enables Dash to directly consume data from an NGSI-LD broker. See Figure 2 for an example visualisation of the ODALA deployment in Kiel.
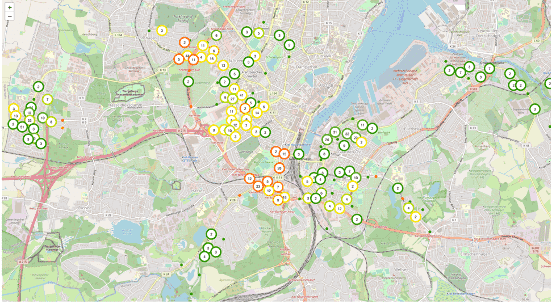
Figure 3. Mobility Data Dashboard
Manual Installation
Install and deploy OpenPath. See OpenPath instructions for detailed steps. Docker container is available. Note that the Mobility Data Toolkit will still work without this step, but the estimation of lengths of Vehicle observations is only roughly estimated by putting a normal distribution around average length trips for different transport modes.
Install and deploy an NGSI-LD context broker. E.g., follow the instructions for Scorpio here. Docker container is available.
Push Vehicle or TrafficFlowObserved data to the NGSI-LD context broker or try our the traffic simulation included in the Green Digital Twin to simulate data. Note: For MDM data or NGSIv2 data you can simply use the adapters available in this repository. If OpenPath is deployed, start the NGSI-LD adapter that takes data from OpenPath and continuously publishes it as SectionObserved entities in the context broker.
Start the Green Transport Twin, e.g., by using docker or by manually starting the python script.
Start the Dash ngsildmap script and observe the CO2 data in the dashbaord 🙂
Installation using docker-compose
We also provide a docker-compose file that will fetch and start all the necessary components automatically. Please note that this still requires the following manual steps:
set the necessary configuration for OpenPath (see OpenPath documentation for that)
setup your existing sensing infrastructure to push data as Vehicle type) to the NGSI-LD broker.
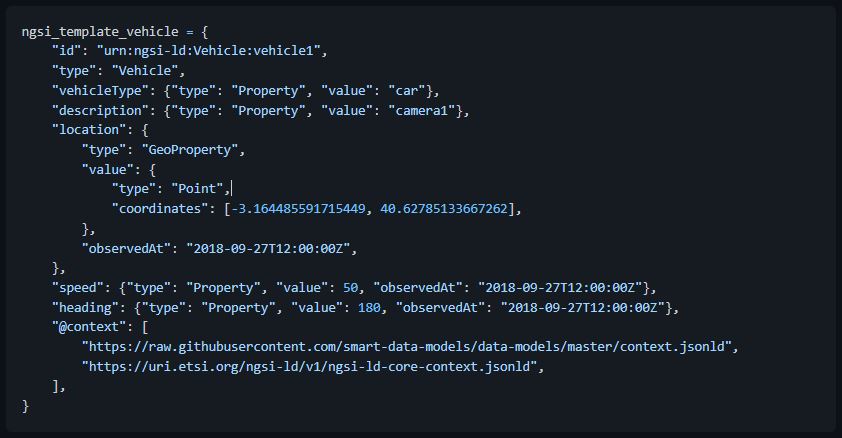
The mobility data toolkit relies on the following data models:
Vehicle
SectionObserved
EmissionObserved
We are working on further refining SectionObserved and EmissionObserved so they can become part of the official FIWARE smart data catalogue.
See below for example instantiations of these data models.
Mobility Data Toolkit is licensed under BSD-3-Clause.